Optimising nitrogen fertiliser application
Optimised nitrogen (N) fertilisation is a prerequisite for efficient agriculture. The advantages are obvious: the highest yields are achieved, expensive N surpluses are reduced, and N losses causing environmental pollution are prevented. With FARM/IT you will also find your individually optimized strategy for N fertiliser application in wheat.
Site-specific soil characteristics and growing conditions result in seasonal variation in crop N demand. In order to ensure an optimal N supply, the application rate and time must be adapted to the individual crop N requirements. The accumulated crop N uptake up to the time of fertilization is particularly important for the determination of N demand. Measurement of the light reflected from the crop canopy, the so-called "spectral measurement", is a modern non-destructive method for determining the crop N status.
The FARM/IT approach for N management is characterised by the unique combination of spectral measurements with crop growth models. This will make recommendations for optimised season-specific N application possible.
What are spectral measurements?
In the course of "spectral measurements", the light reflected from the crop canopy is measured. Plants reflect the different regions of the electromagnetic spectrum differently. The magnitude of the reflection in visible light (400 – 700 nm) and near-infrared radiation (700 - 1300 nm) depends on the N content of crops (Figure 1).
Data from spectral measurements can be used to calculate vegetation indices (e.g. Canopy Chlorophyll Content Index (CCCI) and Normalized Difference Red Edge (NDRE)), which provide accurate information on the actual N status of plants.

Figure 1: Spectral reflectance of crop canopies with different N fertilisation. With increasing N-supply rate, the absorption of visible light (400 – 700 nm) and the reflection of near-infrared radiation (above 700 nm) increases.
How are spectral measurements conducted?
Spectral measurements are conducted using "spectrometers". At the push of a button, information about the light reflected from the crop canopy is collected. Hereby, instead of digital images, data on the reflected radiation from crop canopy are recorded.
As part of the FARM/IT project, the Division of Agronomy at the University of Natural Resources and Applied Life Sciences Vienna (BOKU) conducts wheat field experiments at the University Research Centre Tulln (UFT). Extensive data (e.g. time series of soil water/N contents as well as canopy biomass and N concentrations) and spectral measurements are being collected from plots with different winter wheat varieties and N-fertilisation levels.
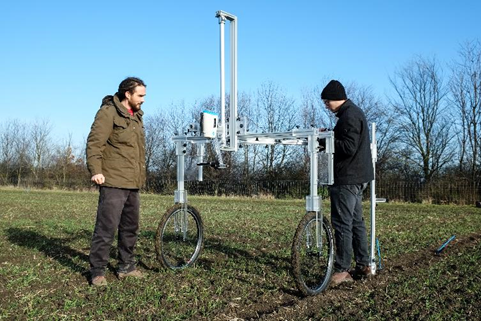
To ensure quick and accurate measurements of spectral reflectance in the field plots, a standard measurement protocol and a “Phenocart” have been developed. The "Phenocart" is a custom-made mobile device constructed for spectral measurements in these plots (Figure 2). Equipped with a hyperspectral sensor connected to a computer laptop, the “Phenocart” enables quick measurement and storage of light reflection from crop canopies.
How are N fertiliser recommendations calculated?
The innovative FARM/IT approach for estimating demand-based N-fertilisation is to link spectral data with crop growth models. Crop models simulate the biomass production of crops during the growing season based on actual weather data or weather forecasts, while spectral data deliver vegetation indices for calculating crop N status. Crop models also provide the information on likely further growth and development of crops, which are used for making N-fertiliser recommendations.
